Optical degradation
Question
Can the toolkit classify the dominant optical degradation in an image, and does the manifest adapter plus the reporting layer generalize beyond CIFAR-10?
This is a framework and diagnostics showcase. The images are 32×32 CIFAR-10 base images with synthetic degradations, so it is not a production image-quality benchmark.
Classes
| Label | Optical analogue | Implementation |
|---|---|---|
clean |
no dominant degradation | unchanged |
defocus |
defocused PSF | Gaussian blur |
motion_blur |
motion during exposure | oriented line kernel |
chromatic_aberration |
wavelength-dependent magnification | per-channel radial scale |
vignetting |
off-axis illumination falloff | radial gain mask |
sensor_noise |
photon and read noise | Gaussian + Poisson |
jpeg |
compression artifacts | JPEG round-trip |
flowchart LR
    Deg["Optical degradation"] --> Clean["clean"]
    Deg --> Blur["defocus / motion_blur"]
    Deg --> Color["chromatic_aberration / vignetting"]
    Deg --> Sensor["sensor_noise / jpeg"]
flowchart LR
Group["Base image group"] --> Split["Assign split before generation"]
Split --> Train["train"]
Split --> Val["validation"]
Split --> Test["held-out test"]
Train --> Manifest["manifest.csv + generated images"]
Val --> Manifest
Test --> ManifestSeverity is sampled per sample from a configured range and written to the manifest.
Data and split
The generator uses selected CIFAR-10 training images as base images. Each base image is a group; groups are assigned to train/validation/test before any degraded sample is generated. The manifest records:
path,label,split,group,severity
The manifest adapter reads the CSV and the explicit split column. The generator
is deterministic for a seed, and the --quick path uses fewer base images.
Model and report
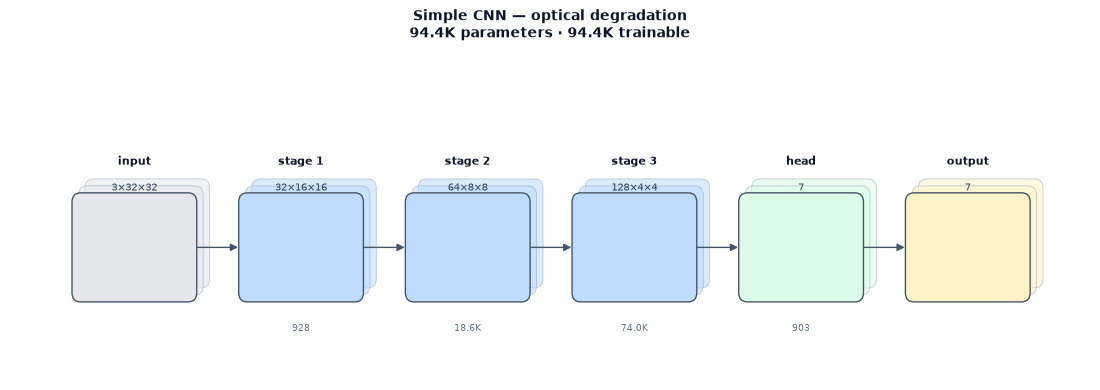
A small simple_cnn with 32/64/128 channels and 94,375 parameters trains
through the same trainer, evaluator, and report path as the CIFAR demos. The
schematic shows the stage shapes; the report includes the confusion matrix,
per-class metrics, calibration, and an error gallery. The useful analysis is
which degradations are confused with which.
Result
2,100 generated samples; 420 test samples (60 per class).
| Field | Value |
|---|---|
| Test accuracy | 85.71% |
| Test macro F1 | 85.57% |
| Test accuracy 95% CI | 82.38–88.81% |
| Best validation accuracy | 82.38% (epoch 16) |
| Latency | 0.70 ms/image |
| Class | F1 | Support |
|---|---|---|
| clean | 70.18% | 60 |
| defocus | 92.68% | 60 |
| motion_blur | 85.00% | 60 |
| chromatic_aberration | 100.00% | 60 |
| vignetting | 78.33% | 60 |
| sensor_noise | 91.80% | 60 |
| jpeg | 80.99% | 60 |
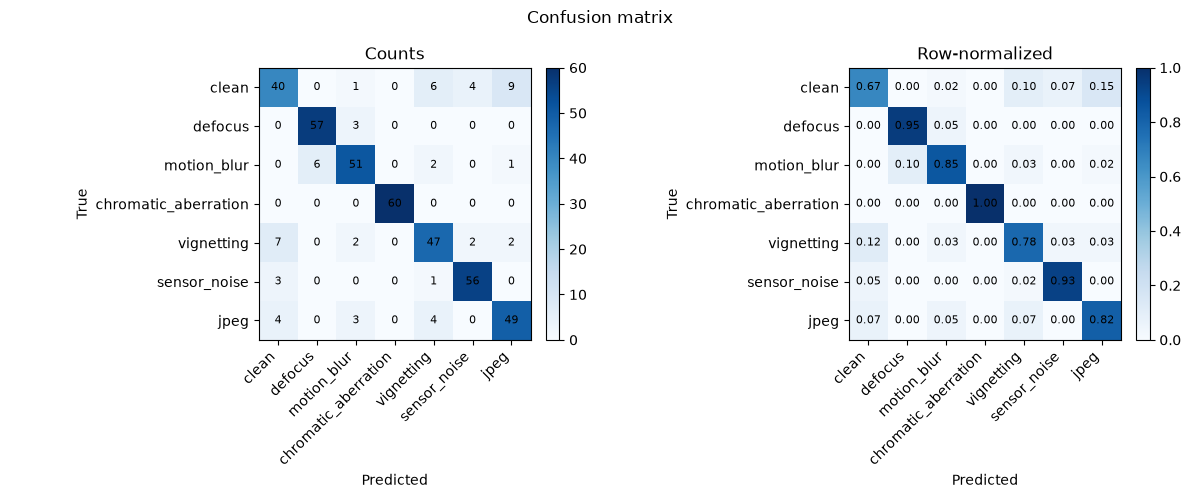
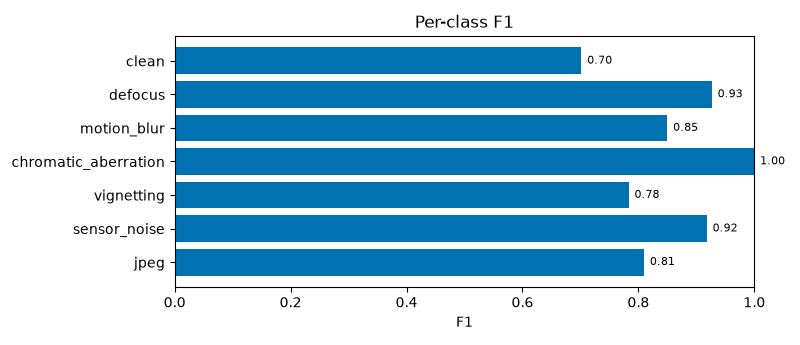
Clean is the hardest class, as expected for subtle degradations at 32×32. Chromatic aberration, defocus, and sensor noise are classified reliably.
What to notice
- A second dataset needs no code changes. Only the adapter and config change.
- Group leakage is checked before generation. No base image appears in two splits.
- The diagnostics are the point. Confusion and calibration are more useful than a single accuracy number.
- The caveat is explicit. 32×32 synthetic degradations are a framework demonstration.
Caveat
Some optical effects are subtle at 32×32. The demo does not claim production image-quality performance; it shows that the data, training, evaluation, and reporting layers generalize to a manifest-based task.